Field note · 3 April 2026
Three marks in one zone
Confluence is not a pile of lines. It is independent reasons landing in the same band of price.
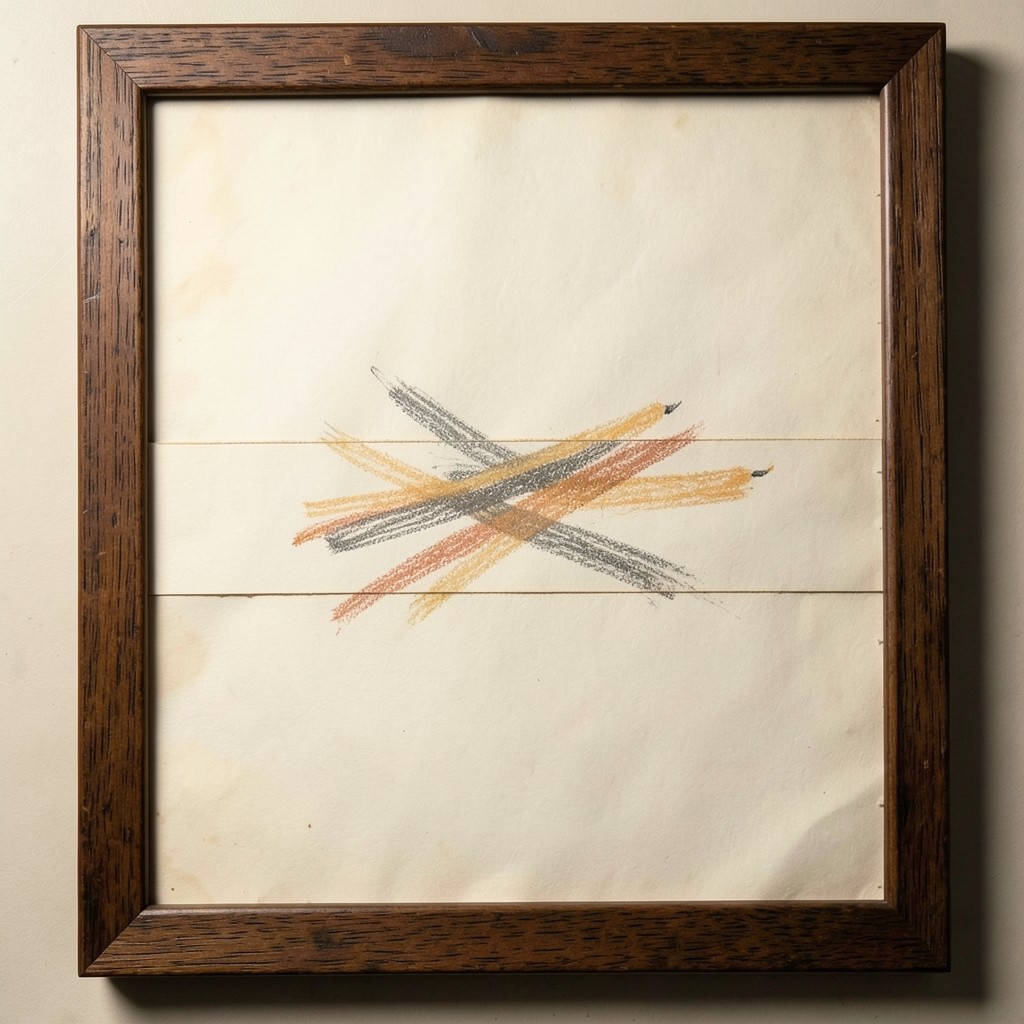
Students arrive with charts that look busy and feel certain. Three parallel lines, a box, two moving averages they do not use during the week, and a trendline drawn because the software offered the handle. We clear the page back to horizontal prices. Confluence, in this room, is a statement about those prices only.
A reason is independent when you could have found it without the others. The weekly swing high is one. The daily gap from a different month is another. A session open that held on a day with no relation to either print is a third. If all three sit inside a zone you could cover with a thumb on a daily chart, you have confluence. If they are the same swing described three ways, you have one level and a crowded margin.
The zone is allowed to be a band. Price does not owe you a single tick. We write the band as a high and a low of the overlap, not as a fantasy midpoint. The midpoint tempts people into a false precision that the original swings never had.
Confluence is also a place to remove work. When two of your lines collapse into one reason, erase one. The map should get quieter as it gets more serious. A page with twelve levels is a diary. A page with four, two of them confluent, can be carried into a week.
On the Confluence Desk this is the middle of the hour, and it is where most of the pencil shavings end up. People are rarely short of lines. They are short of reasons that do not depend on each other.